Your HRV is trying to tell you something. Most people ignore it.
I've been wearing a Fitbit for years. It tracks my HRV every night. And for most of that time, I had no idea what to do with the number.
The app shows you a daily value, something like 29ms or 34ms, and a vague trend line. It doesn't tell you why the number dropped or what you did yesterday that might explain it. Just a number floating on a screen.
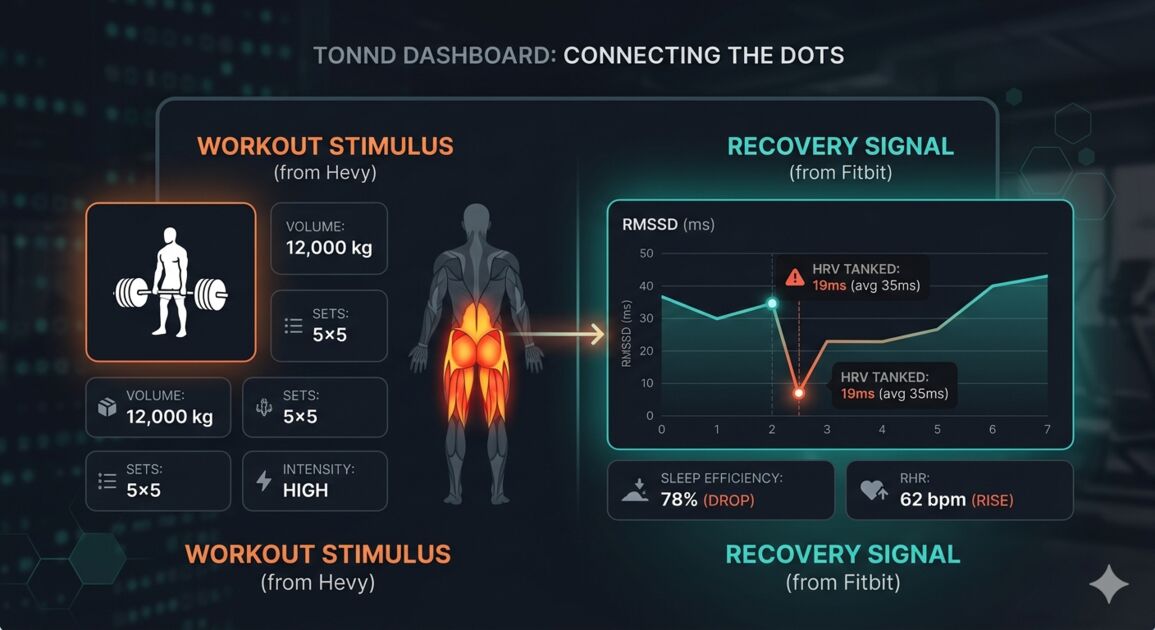
Then I started lifting. Three times a week, full body, logged in Hevy. And I noticed something: on mornings after heavy deadlift days, my HRV tanked. From 35ms down to 19ms. Sleep efficiency dropped too, usually by 8-12 percentage points. But Fitbit never connected these dots because it doesn't know I lifted. It only sees the heart.
That's when I started paying attention. The number by itself wasn't useful. The number next to what I did yesterday was.
What HRV actually measures
Heart rate variability is the variation in time between consecutive heartbeats. If your heart beats at 60 bpm, it doesn't actually beat once per second like a metronome. The gaps between beats might be 0.95 seconds, then 1.05, then 0.98. That variation is your HRV.
Higher HRV generally means your parasympathetic nervous system (the "rest and digest" branch) is dominant. Your body is recovered and can handle stress. Lower HRV means the sympathetic side is still running. Your body is dealing with something: a hard workout, bad sleep, too much coffee, stress at work. Could be anything.
The metric most wearables report is RMSSD (root mean square of successive differences), which captures beat-to-beat variation and correlates strongly with parasympathetic activity. Fitbit calls it simply "HRV." It's measured during your deepest sleep, which is when autonomic readings are most stable.
What the research says
I expected the HRV research to be vague and hand-wavy. It's not. Some of these papers actually changed how I train.
A 2024 narrative review in the Journal of Strength and Conditioning looked at HRV applications in strength and conditioning. The key finding: athletes who used HRV-guided training — where workout intensity was adjusted based on daily HRV readings — achieved the same or better performance gains with fewer high-intensity sessions than athletes following fixed programs. In other words, training smarter by listening to your autonomic nervous system worked at least as well as training harder by following a rigid plan.
A 2025 systematic review in Frontiers in Cardiovascular Medicine analyzed the effects of long-term exercise on HRV across multiple studies. They found that consistent exercise — both aerobic and resistance training — significantly improved the LF/HF ratio, a marker of sympathovagal balance. The benefits were more pronounced in people who already had health conditions, and in programs lasting 8 weeks or more.
And here's the part that got me thinking about dashboards: a 2025 review on monitoring training adaptation argued that single-day HRV readings are nearly useless in isolation. What matters is the weekly trend — specifically the weekly RMSSD mean and its coefficient of variation (CV). When your weekly HRV mean goes up and your CV goes down, you're adapting well. When the pattern reverses, something is off. One case study found a correlation of r ≈ 0.92 between weekly RMSSD CV and race performance over an entire season.
That's a useful finding. But to actually do anything with it, you need your HRV trend and your training load on the same screen. Which, of course, no single app gives you.
The problem with separate apps
I wrote about this before when Google killed the Fitbit web dashboard. But the fragmentation goes deeper than losing a website.
Right now, my health data lives in three places:
- Fitbit tracks sleep, heart rate, HRV, steps, SpO₂, breathing rate, skin temperature, VO₂ Max, and active zone minutes
- Renpho tracks weight, body fat, muscle mass, BMI, and visceral fat
- Hevy tracks workouts — exercises, sets, reps, weight, and volume
Each app is fine on its own. But they don't talk to each other, and the one question I actually care about, "is what I'm doing working?", needs all three: the training stimulus (Hevy), the recovery signal (Fitbit), and the outcome (Renpho). Same screen. Same timeframe.
So I built TONND to do that.
How TONND connects the dots
When I started this project, it was just Fitbit data in a dashboard. One data source, one screen. Useful, but limited.
Now TONND pulls from Fitbit, Renpho, and Hevy into a single dashboard. The metrics are split into two zones:
The top half shows your current state: weight this morning, HRV last night, last workout, resting heart rate. Always the latest reading. The bottom half is trends, with a 7/14/30 day toggle for charts: steps, calories, sleep duration, HRV, weight (smoothed with EWMA), workout volume, and a scatter plot showing how sleep efficiency and HRV move together over time.
There's also a recovery score: 40% HRV, 35% sleep efficiency, 25% resting heart rate. It's a single number. I look at it before deciding whether to train or rest. It doesn't tell me what to do, but it does make the decision feel less arbitrary than "the schedule says Monday."
There's also a muscle heatmap: a body diagram where color intensity shows which muscle groups you've hit recently. You can click a muscle group to see which exercises contributed. The muscle assignments come from Hevy's exercise template API (primary and secondary muscle groups per exercise), so they're accurate instead of being guessed from exercise names.
Why weekly trends matter more than daily numbers
This took me a while to internalize: individual daily HRV readings don't mean much.
My HRV on any given morning can swing from 19 to 42 depending on whether I had a glass of wine, trained legs, slept in a warm room, or stayed up watching YouTube until 1am. A single number on a single day is almost meaningless.
What matters is the 7-day rolling average and how stable it is. The research backs this up: Munoz et al. found that RMSSD measured over just 1 minute correlated at r > 0.90 with standard 5-minute recordings. And Flatt and Esco showed that weekly RMSSD CV — how much your HRV bounces around from day to day — was a better predictor of performance than the absolute number.
So a "low" HRV of 22ms that's been stable all week is actually fine. A "high" HRV of 38ms that was 45ms three days ago might be a warning sign.
This is why TONND defaults to a 7-day view and smooths weight data with EWMA. Once you stop reacting to individual days and start looking at weekly patterns, things get a lot clearer.
The muscle heatmap — seeing where the stress went
One of the things I added recently is a muscle heatmap that shows front and back views of the body, colored by how much each muscle group was worked over the selected time period.
The data comes from Hevy's exercise template API. Each exercise has a primary muscle group and secondary muscle groups. A bench press primarily targets chest, secondarily shoulders and triceps. A deadlift hits glutes, hamstrings, quads, lower back, upper back, lats, and traps. The dashboard weights primary muscles at 1x and secondary at 0.4x, then visualizes the result as color intensity on the body diagram.
Why does this matter for recovery? Because research on resistance training and HRV shows that the type of loading — not just the volume — affects autonomic recovery. A 2019 study found that maximum strength loading (singles at 100% 1RM) caused a significant increase in low-frequency HRV power at 48 hours post-exercise, while hypertrophic loading (sets of 10 at 70% 1RM) did not. The sympathetic nervous system responded differently to different training stimuli, even when total volume was similar.
Being able to see which muscles you loaded, next to your HRV trend the following days, gives you information that neither app provides alone.
What I actually changed about my training
I'm not an athlete. I'm a developer who lifts three times a week and would like to stop feeling wrecked by Wednesday. But staring at my own data for a few weeks did change how I train.
I stopped going to the gym when my recovery score is below 50. I used to push through because the plan said Monday. Now I look at the number and sometimes I just don't go. It feels weird to skip a scheduled workout, but my weekly averages have been better since I started.
I also noticed that sleep efficiency predicts my next-day HRV better than anything else. The correlation chart shows a Pearson r of 0.61 between sleep efficiency and next-morning HRV. That's moderate, not dramatic, but consistent enough that I started taking sleep more seriously than training volume.
The biggest change was deadlifts. Looking at the muscle heatmap, I saw my lower back was getting hit 3x per week because deadlifts, rows, and squats all list it as a secondary muscle. My HRV was reliably low mid-week. I moved deadlifts to once a week and my weekly RMSSD mean went up about 15%.
I didn't need a coach for any of this. I just needed the data in the same place.
Where this goes next
Right now TONND shows you the data and you draw your own conclusions. Eventually I want to connect it to an LLM, feed it 30 days of your data, and have it find patterns you missed. Not "drink more water" advice, but actual observations about your specific numbers.
Further out, the AI would live inside the dashboard. You'd open it and the analysis would already be there, already noticing that your HRV has been sliding down while your training volume went up.
But honestly, even without the AI part, just having HRV next to workout volume next to sleep next to weight on one screen already changed how I think about training. Turns out the data was always there. It was just in five different apps.
TONND is free and open source. tonnd.com or self-host with Docker. Code is on GitHub.